February Housing Market Statistics
What goes down, must come up…
Well, at least with Single Family home sales in Las Vegas, this is looking to be true. We’ve seen a roller coaster over the last 6-7 months, and the end may not be upon us, but the stats I do pay attention to are showing some signs of strength! While data is still being crunched and updated, this is going to be pretty close to the full report that will be released by LVR next week. As always, these data points are for Single Family Homes ONLY.
PENDING SALES
Pending Sales are what I pay attention to a lot, as they are the catalyst for future activity. In February, we saw more than 2300 Pending Sales, which has been a dramatic jump for us compared to the prior few months. In fact, it is a level we have not seen since May of last year. While Pending Sales at 2300 are still about 16% lower than they were in February of 2022, we have seen a dramatic increase over the last 2 months. It appears we bottomed in December, when we had 1421 Pending Sales, which, believe it or not represented a 15 year LOW!

If you look at the chart, you’ll see we have a bit more to go before returning to what we were seeing on a monthly basis since right after COVID, but as a reminder, the 2500 - 3500 per month represented a VERY STRONG market. This is a good sign for us as we shift into the Spring Market.
CLOSED SALES
You can’t have a Closed without a Pending, so I focus on the Pending first, but Closed Sales are what drives the market. We have seen a dramatic drop off since March of ‘22, and it does look like we may have bottomed last month with only about 1330 Sales. February saw a sharp turn upward, and we are going to close at over 1700 Sales. Now, that is still almost a full 1/3 LESS than this same time last year, but the month over month increase of just under 29% shows some strength.

As you can see from this chart, the drop has been immense and we do have a long way to regain the status we had in 2021 and 2022, but is that really where things are heading? My guess is NO, but I can see us living in the 2000-2500 per month range for a while, which would restore confidence to the market while we see Mortgage Rates continue to fluctuate between 6 and 7%.
SALES PRICE
When I ran the numbers a few days before the end of the month, I anticipated a Median Sales Price of about $418,000, which would have been a decline from $425,000 in January. What I did not expect was a huge rush to end the month in terms of sales, which actually drove the price HIGHER. We ended February with a Median Price of $424,900 - just $100 shy of where we were in January.
$424,900 is about 6% below where we were at this point last year. So that’s it. The chaos if you look at it in the past year, saw a retreat of roughly 6%. However, if you are playing the daily (or in the case, monthly) game, we did have a high of $481,000 in May, and we are off about 11-12% from the top. While that is a lot, and no one likes to see the value of their home drop, that’s from the ALL TIME HIGH.
Many out there anticipated a 25-50% retracement, which I always felt out of line.
Do we have room to go down further? Yes, we do. But as I always advise on the market; trying to time the market is a mistake. There is no better investment, long term, than real estate, and if you’re looking at things in the long term, we’re still in great shape. Don’t believe me… take a look at these charts…
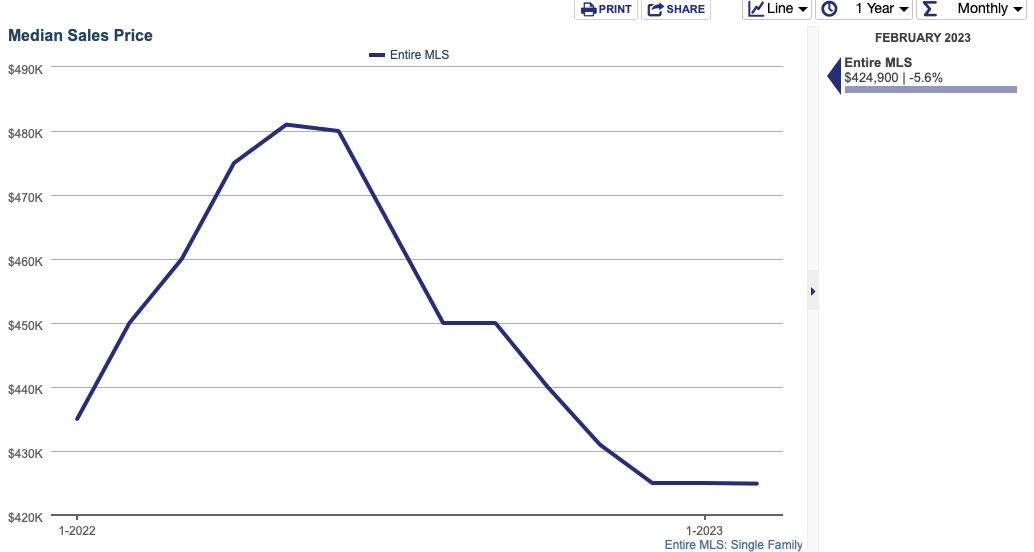
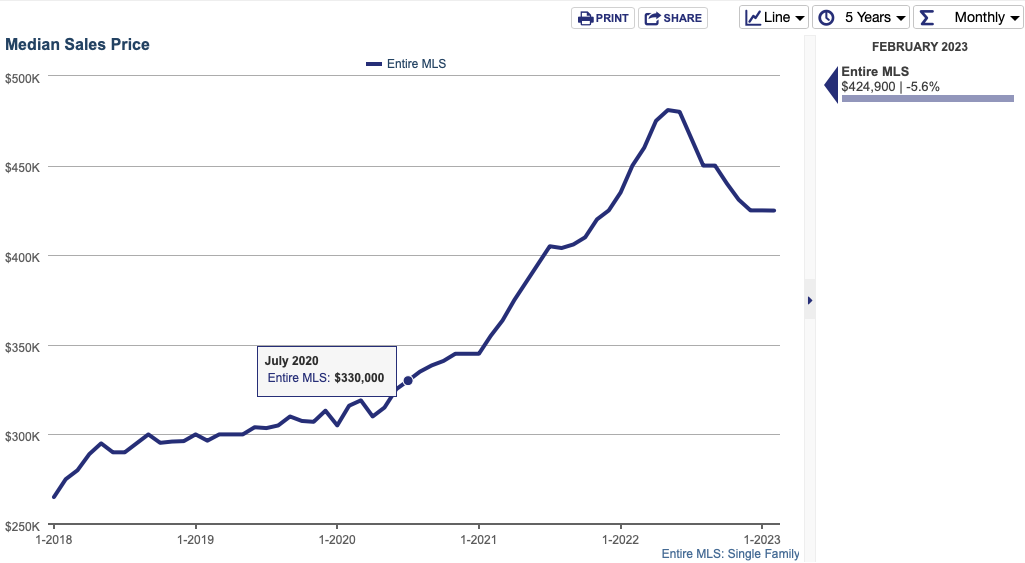
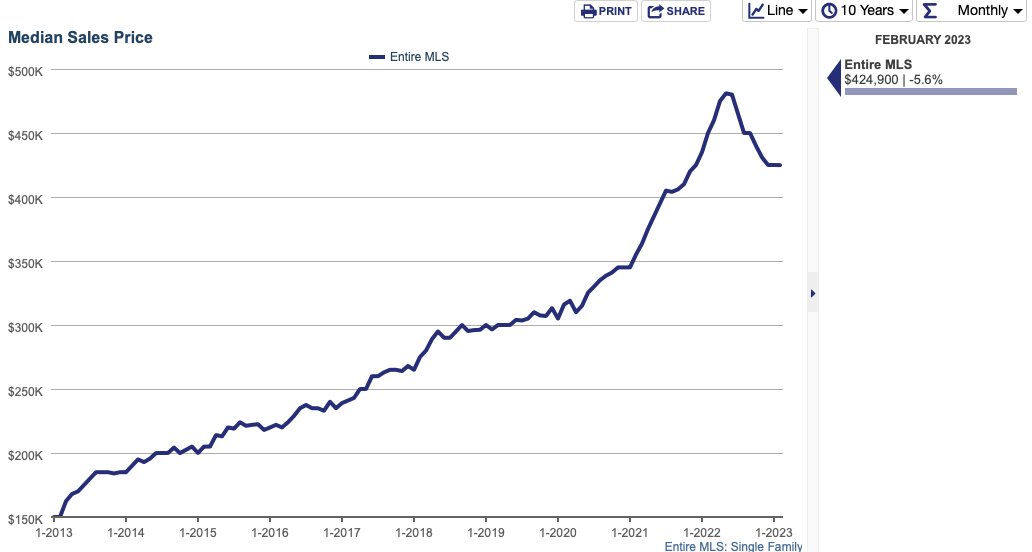
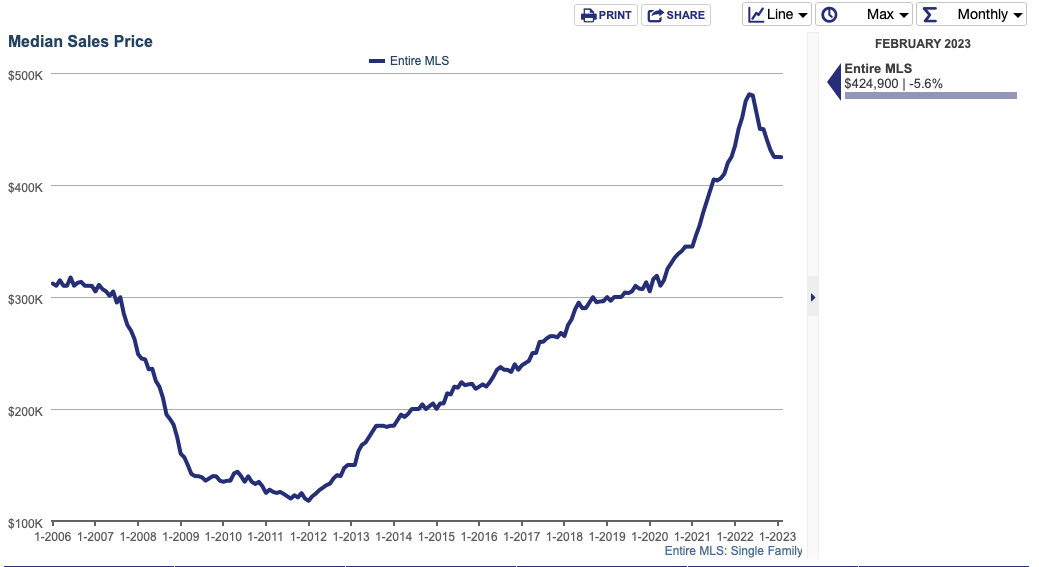
This is ALL the same data. Just in different time frames. The first chart is the 1 year chart, second is the 5 year, third is what values have done over the last 10 years, and the last chart is values over the last 17 years. When it comes to investing in Real Estate, it’s ALL about perspective.
Until the next one…
-GZ